IDE plugins
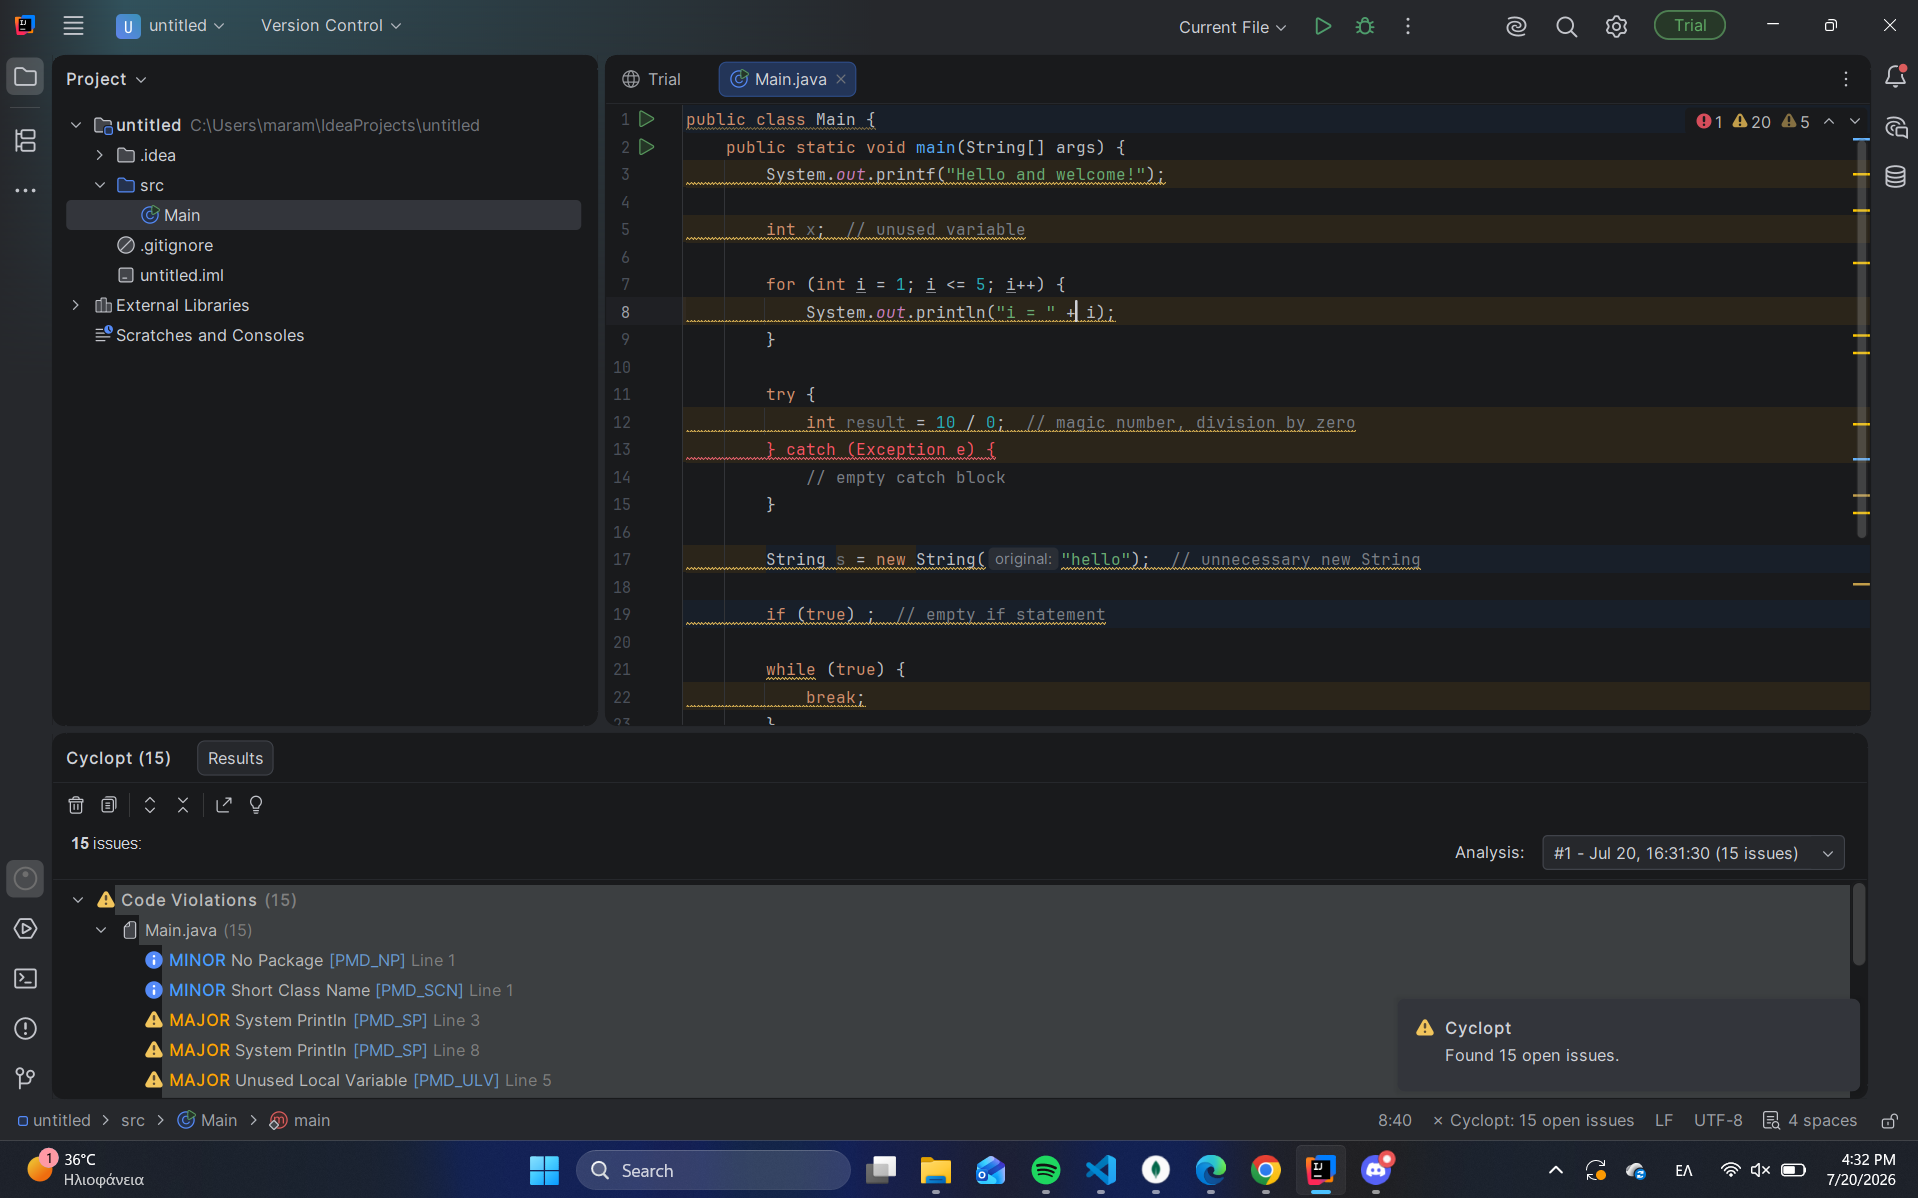
Cyclopt plugins bring code quality, security and maintainability insights directly into your IDE, so you can review your code without leaving your editor. They're available for Visual Studio Code, Visual Studio and JetBrains IDEs.
Install the plugin
Install the Cyclopt extension for your IDE:
- Visual Studio Code: Cyclopt on the VS Code Marketplace
- Visual Studio: Cyclopt on the Visual Studio Marketplace
- JetBrains: Cyclopt on the JetBrains Marketplace
One extension, multiple insights
Run Cyclopt's analyzers directly inside your IDE (metrics, security, violations, duplication, and dependency vulnerabilities), all in one place. Trigger analysis with a single keyboard shortcut (Ctrl+Shift+A) or let it run automatically every time you save. Issues appear inline in your editor, in the Problems panel, and grouped by severity in the Cyclopt sidebar, so nothing slips through.
Fix issues faster with AI
Found an issue you want to fix faster? Right-click any finding in the results panel and select "Create AI Prompt to Fix". Cyclopt generates a ready-to-paste prompt that includes the issue description, severity, and the surrounding code context. Paste it into Copilot, Cursor, or any AI assistant and get a targeted fix immediately.
Automatic analysis of AI-generated code
Cyclopt detects when AI coding tools like Copilot or Cursor modify your files and automatically re-runs analysis on the changed code. You get quality and security feedback on AI-generated code the moment it lands in your editor, without having to trigger anything manually.
Focus on what matters
Not every issue needs to stop your workflow. Cyclopt separates findings into high-priority (critical, major) and low-priority categories, lets you filter the results panel to show only what matters right now, and uses the issue-count badge on the sidebar so you always know where you stand at a glance.
Export and share
When you need to share findings with your team or include them in a report, Cyclopt can export the full results as JSON, CSV, a standalone HTML report, or Markdown, directly from the results panel.
Set up the plugin
1. Set your Cyclopt API token
Open the Cyclopt settings panel from the activity bar, paste your API token from the Cyclopt dashboard, and save. The extension is now connected to your account.
You generate this token in Settings → Cyclopt API Token. See Settings for the exact steps.
2. Set your default analyzers
Select which analyzers you want to run: code metrics, violations, security issues, duplication, or dependency vulnerabilities. You can change this at any time from the settings panel.
3. Run your first analysis
Right-click any supported file and press Analyze Selected Files. Cyclopt submits the file for analysis and displays findings inline in your editor and grouped by severity in the sidebar.
Next steps
Want your AI coding assistant itself to query Cyclopt's analysis? Set up the MCP server.