Code analysis
The Repository Analysis page is where Cyclopt Companion turns each commit into an actionable picture of your code quality. Open it from a repository card's Analysis link, or from the Repositories list.
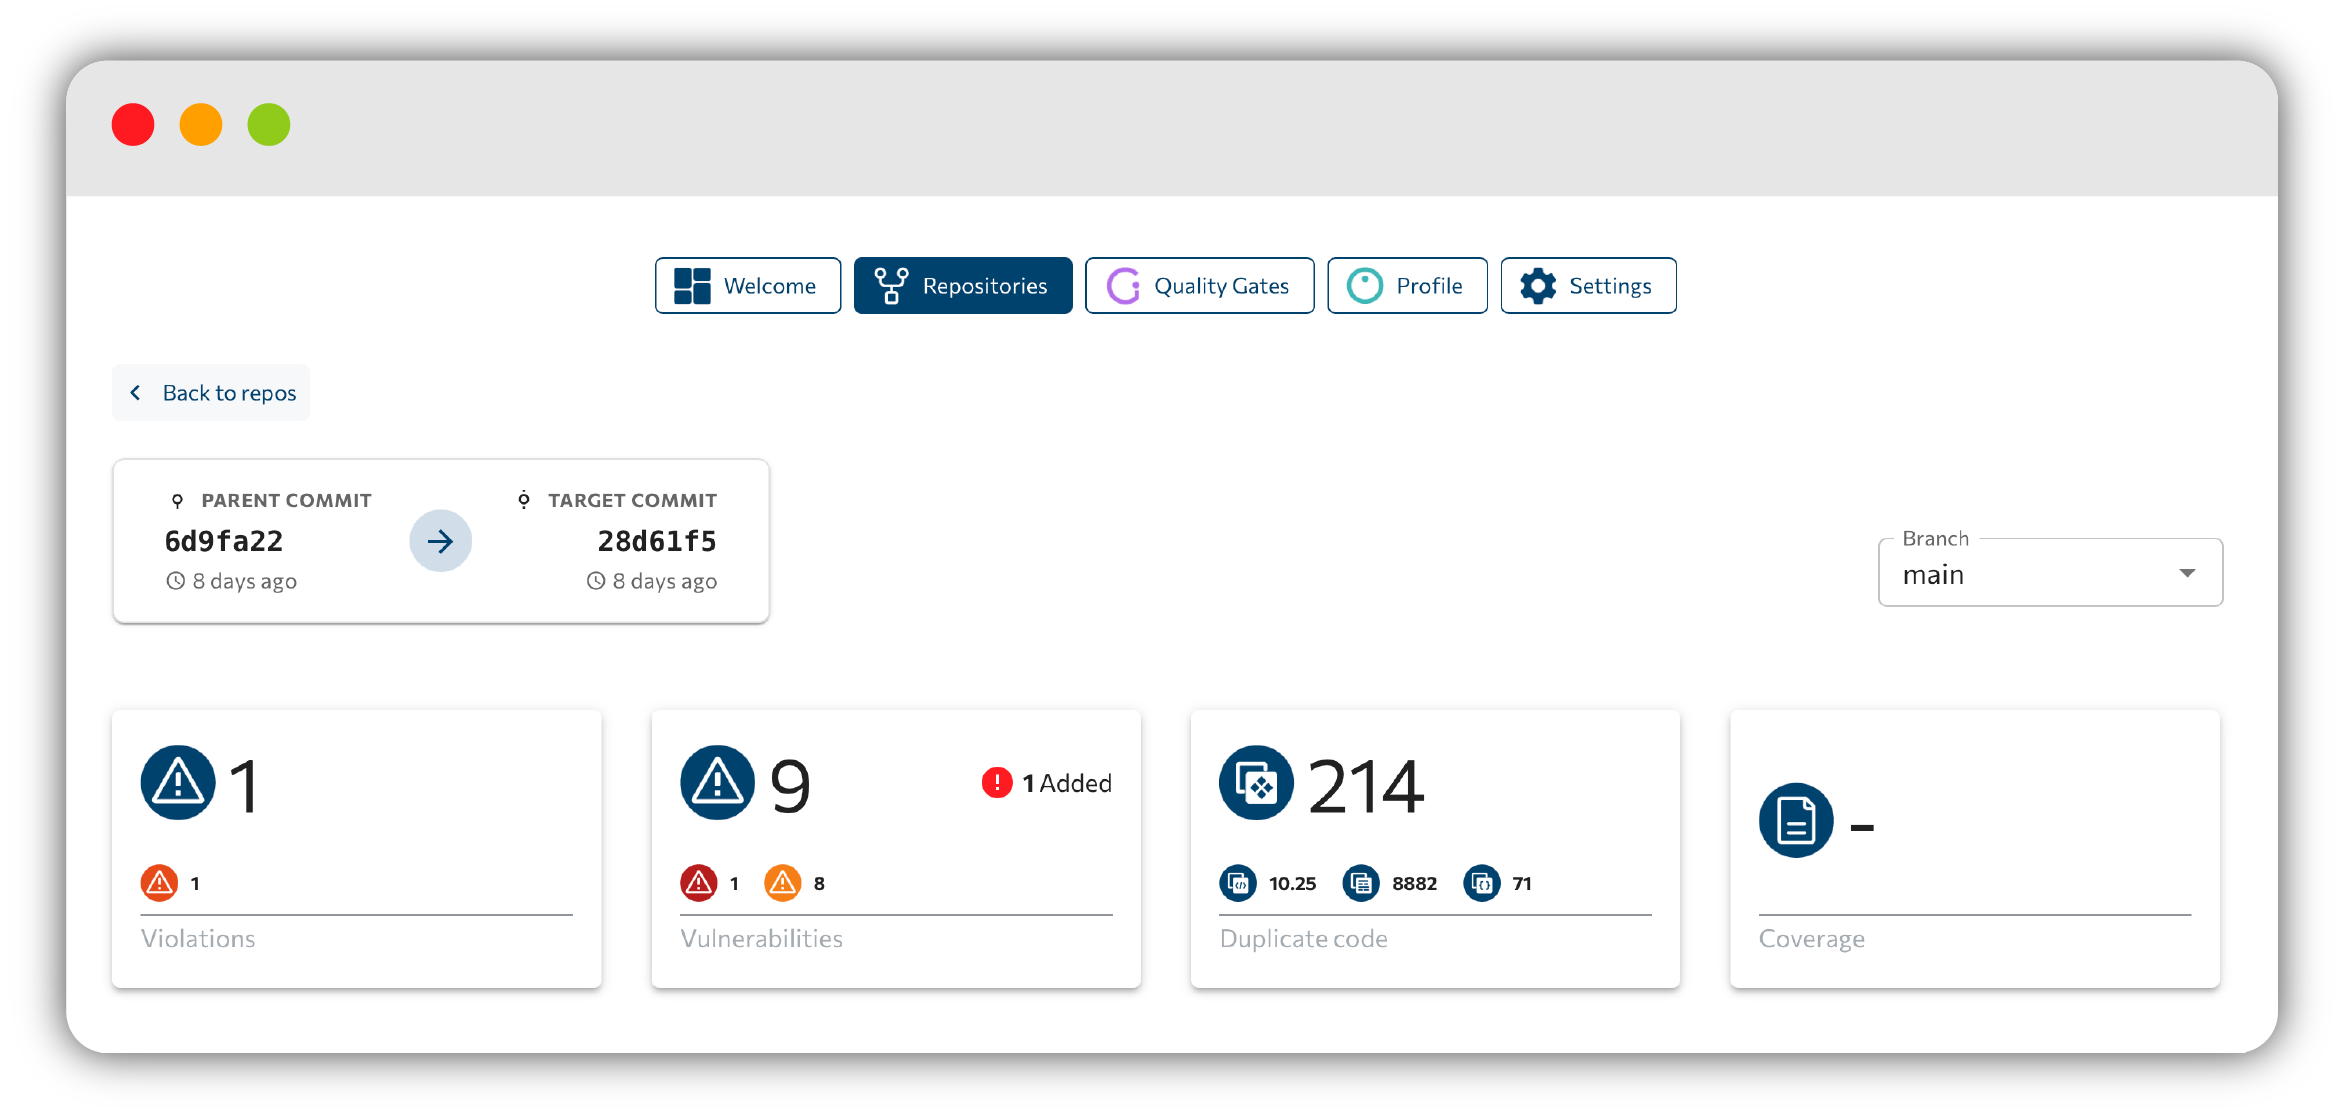
The analysis header
At the top of the page you'll find:
- A Back to repos button to return to your repository list.
- The current commit info and overall grade.
- A Branch selector (an autocomplete) so you can switch between analyzed branches.
Top metric cards
Four cards summarize the health of the selected commit:
- Violations
- Vulnerabilities
- Duplicate Code
- Coverage
Each card shows the current total together with introduced and removed deltas and per-severity icons, so you can immediately see what changed since the previous commit. Clicking a card opens its detail view, presented as tabs: violations, vulnerabilities, duplicates, and coverage.
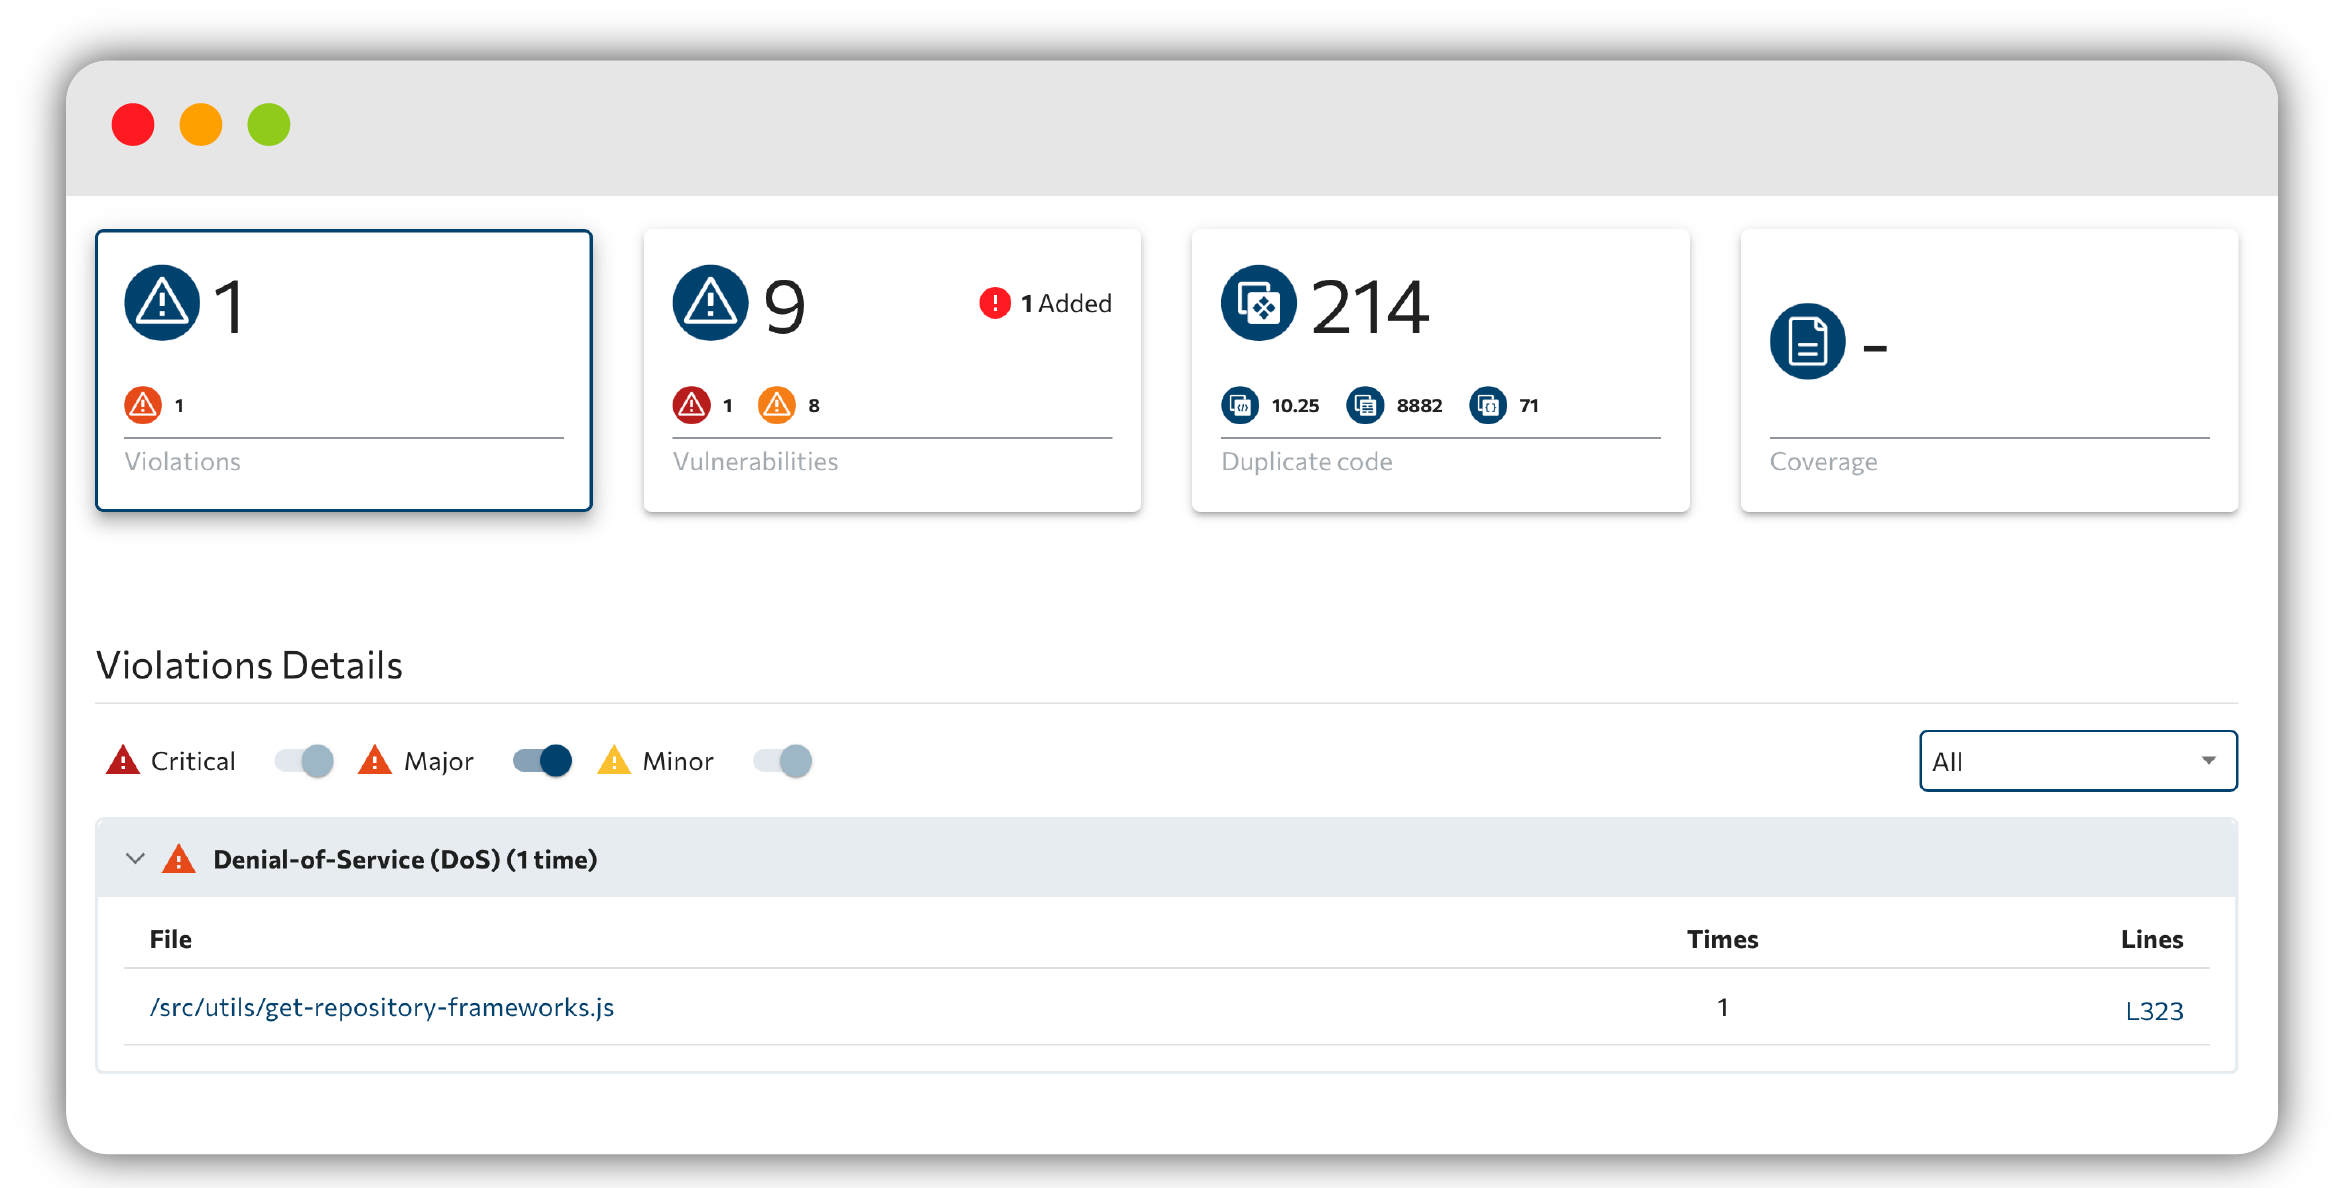
Duplicates view
The duplicates tab surfaces where your code repeats itself, reporting:
- Duplicate instances
- Duplicate LOC
- Classes containing clones
- Duplicate-code %
Coverage view
The coverage tab shows per-file coverage with covered, partially-covered, and not-covered lines. Summary tiles report statements, functions, branches, classes, methods, and instructions.
To see coverage results, the respective coverage result files must exist inside your repository.
Supported formats are mapped by language and filename. JavaScript and TypeScript use the same common coverage inputs, including coverage-final.json, cobertura-coverage.xml, lcov.info, clover.xml, and coverage-summary.json. Java coverage is read from jacoco.xml. Python coverage supports coverage.json and coverage.xml. PHP coverage supports coverage.xml. Some formats provide partial metadata only (for example, missing end-line values or uncovered counters for specific metrics), so reported details can vary depending on the file type used.
From here you can dig into specific findings via Violations & code insights, Security & vulnerabilities, and let the AI assistant repair issues in AI code fixing.
Next step: explore your findings in Violations & code insights.