Quality Analytics
Quality Analytics is where Panorama turns raw code into a clear, comparable picture of health. You can read it at two levels: a project-wide snapshot across all your repositories, or a deep, per-repository breakdown of a single analysis.
Quality at a glance
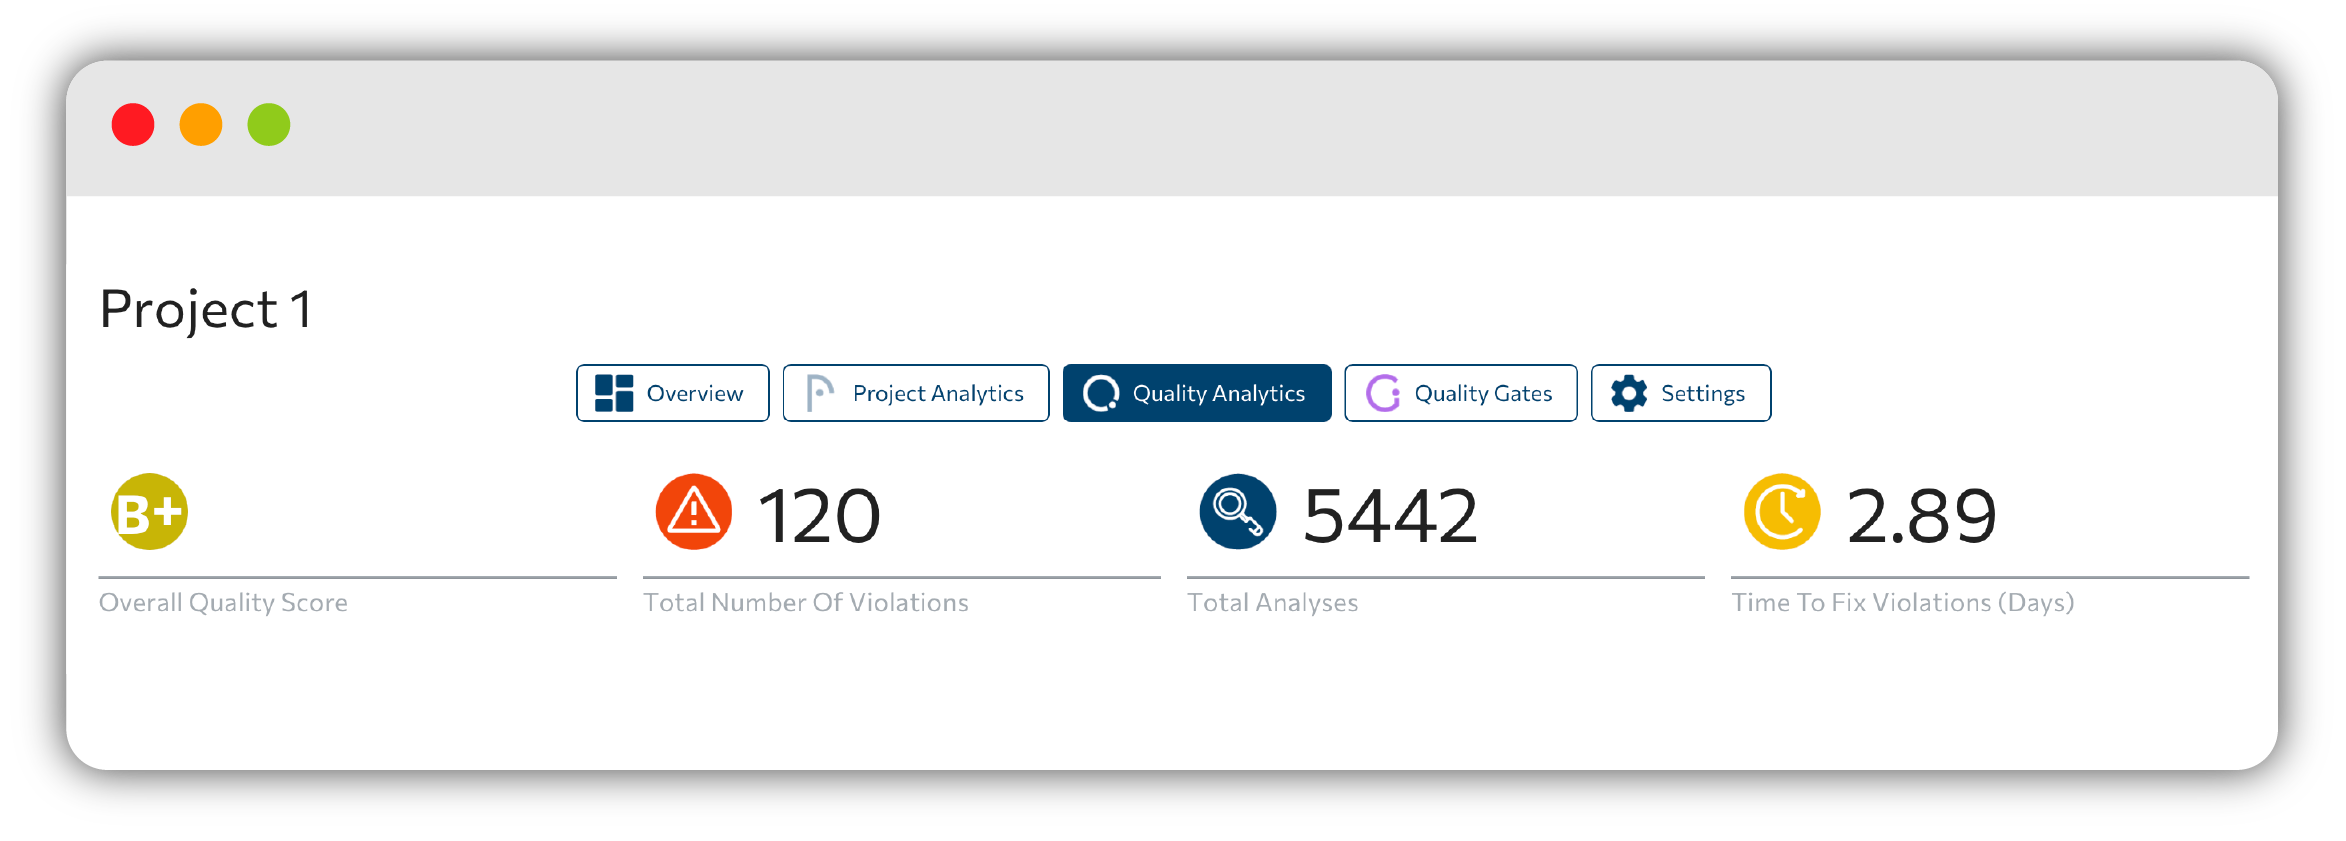
Open a project and select the Quality Analytics tab to see the whole project summarised at the top in a row of tiles:
- Overall quality score: a letter grade shown as an avatar (grades run from A⁺ down to D⁻).
- Total number of violations across the project's repositories.
- Total analyses run so far.
- Time to fix violations: the estimated remediation effort, in days.
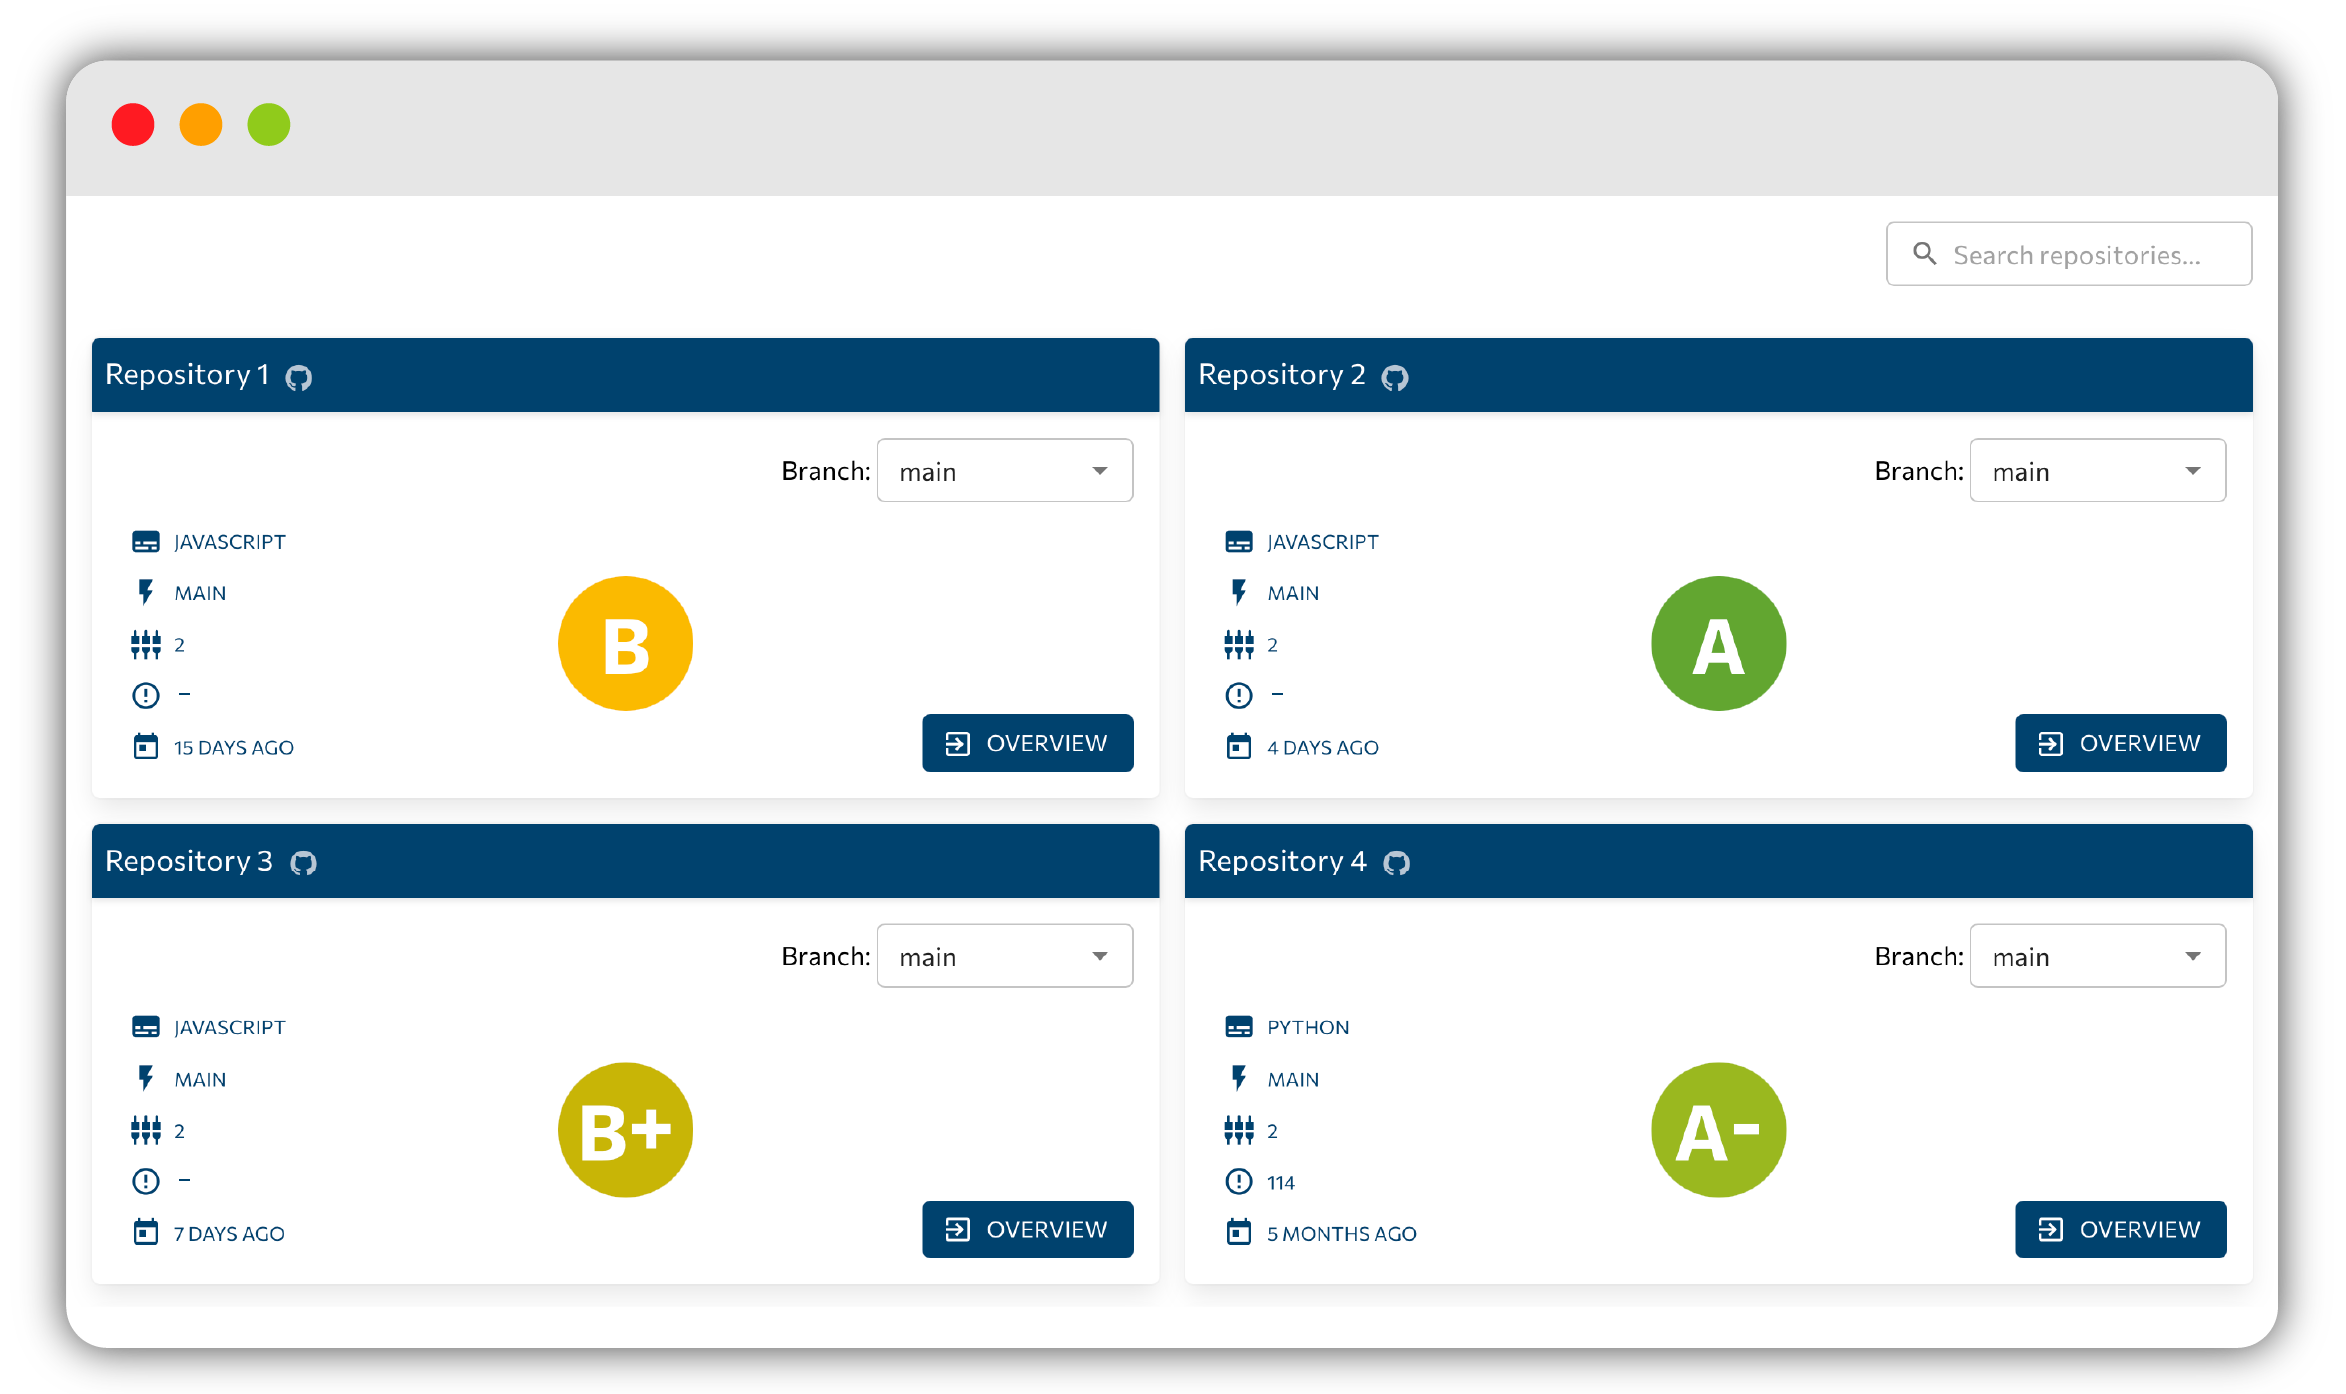
Below the tiles you get a searchable, paginated grid of repository quality cards, one per repository. Use the filter to narrow the grid by owner, name, or root, then select any card to open that repository's detailed view.
Curious how the letter grades are produced? See How Cyclopt analyzes code.
Per-repository Quality Analytics
Selecting a repository card opens its dedicated view. The header keeps the essentials in reach:
- The repository name.
- A branch selector with Branches and Tags, so you can inspect any point in the repository's history.
- The current commit hash, linked back to the provider.
- Latest Analysis: {time} — when the shown data was last computed.
A Bigger Picture / Short View toggle controls how much detail is on screen by changing which tabs are visible. Short View shows only overview, commits, and evolution; Bigger Picture reveals the full set described below.
Overview
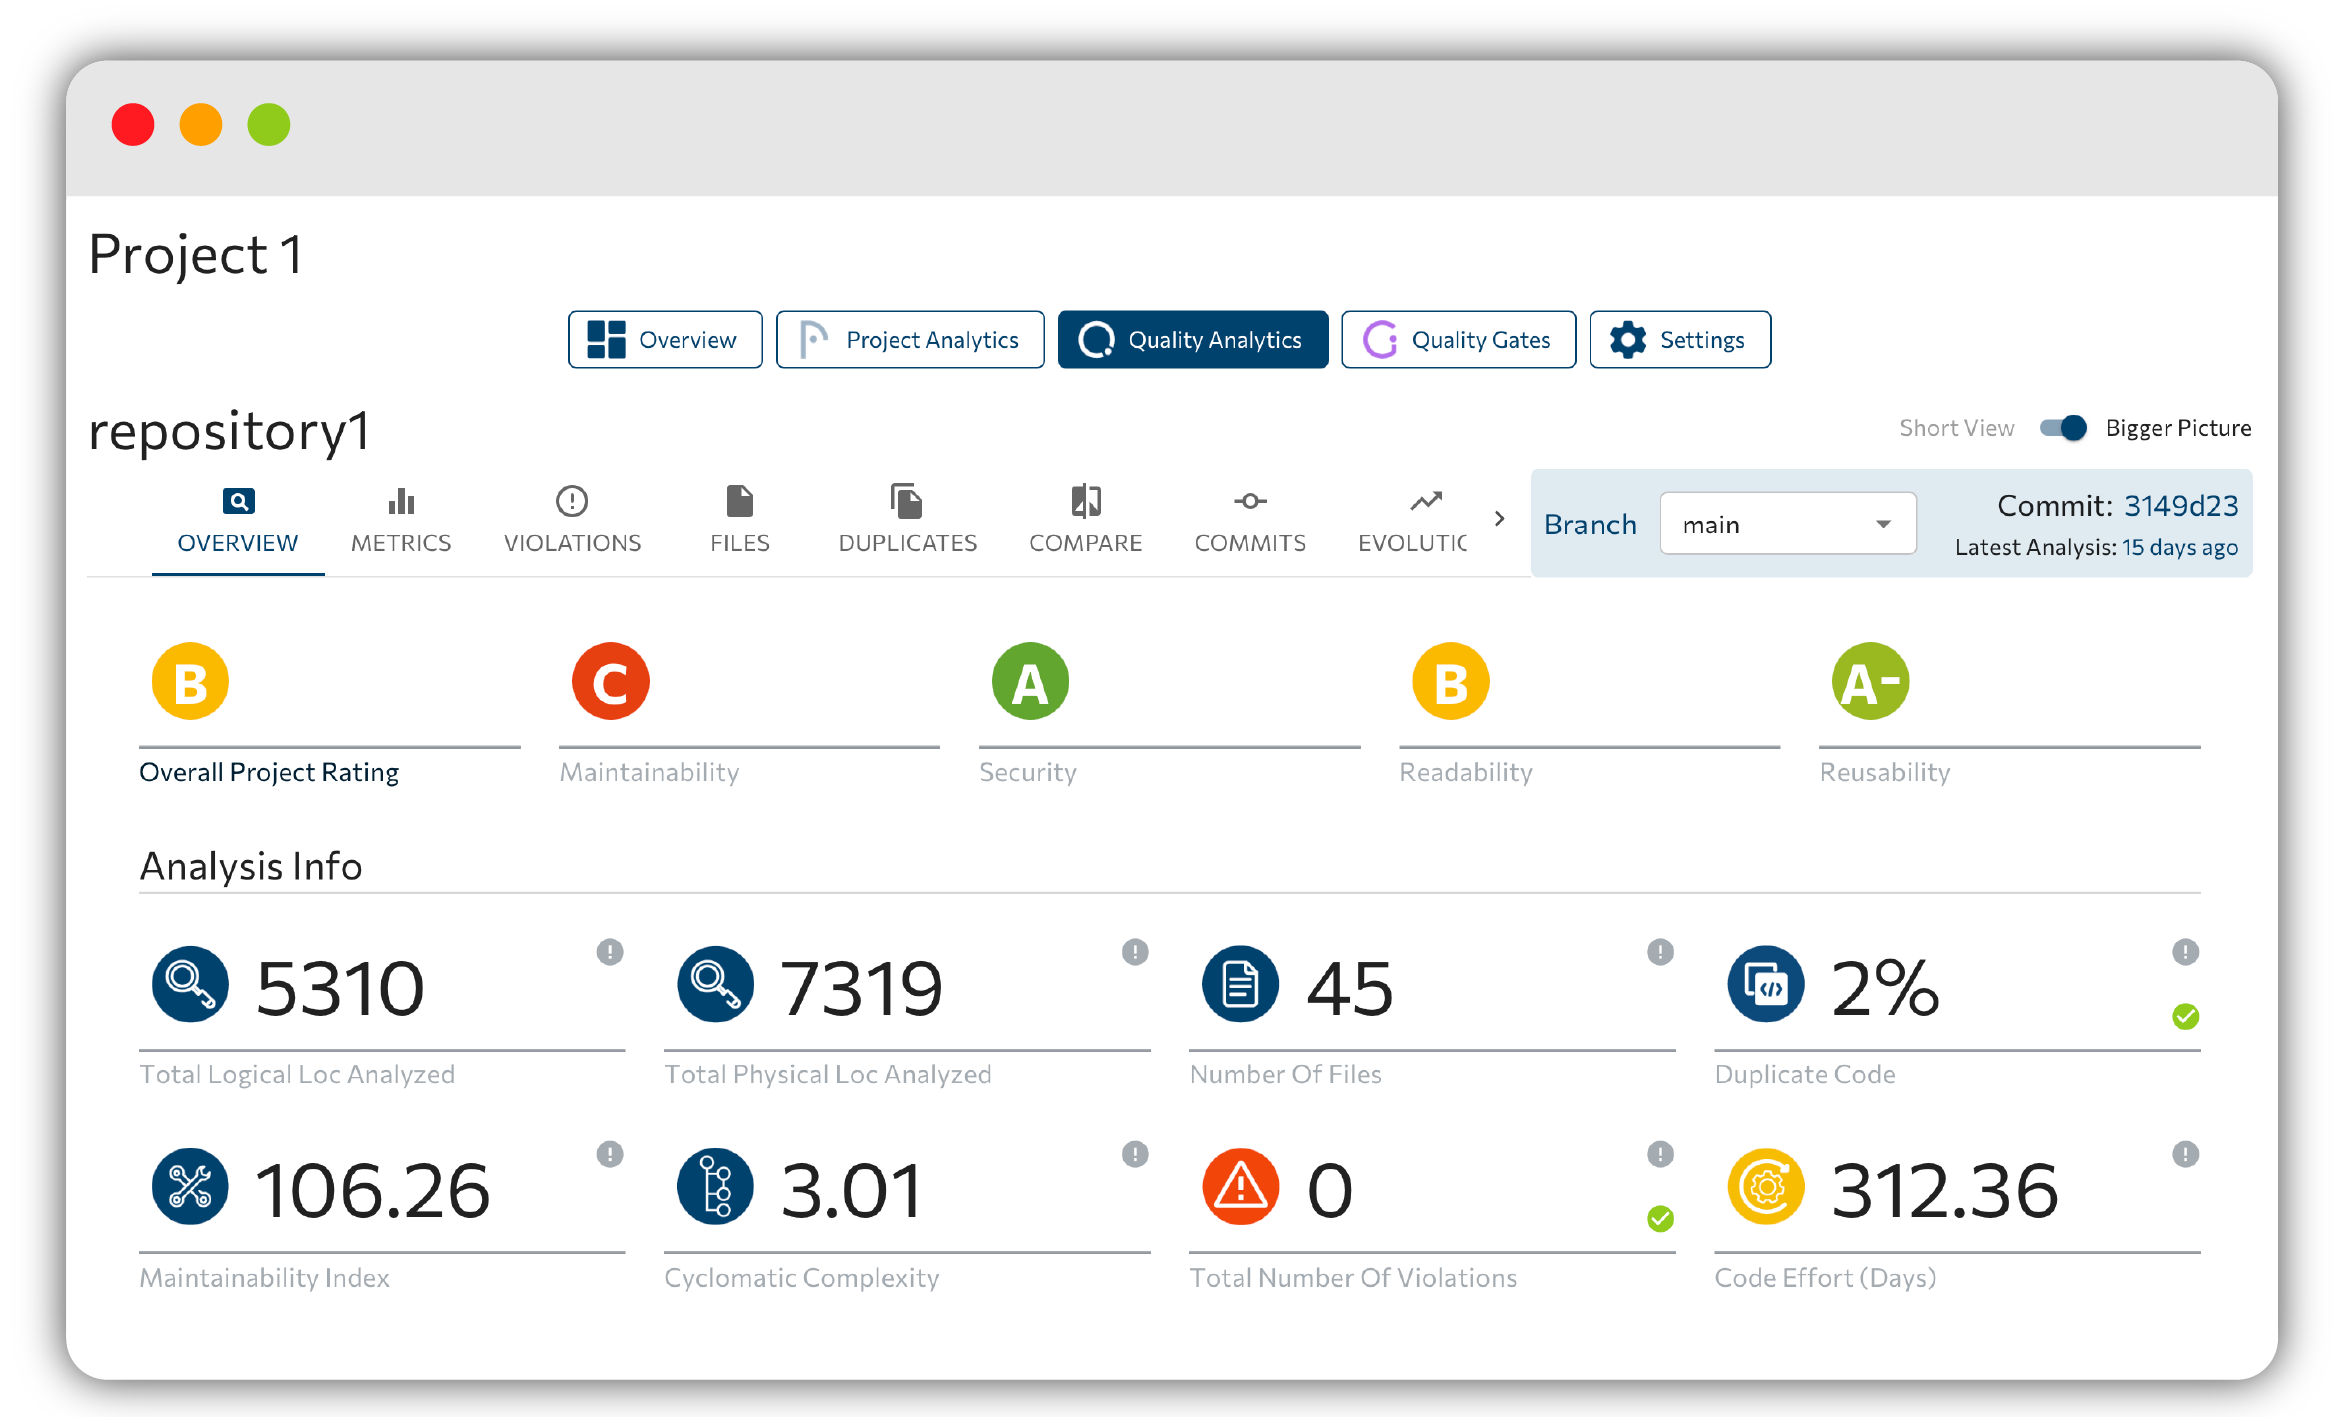
The overview opens with five rating avatars (overall project rating, maintainability, security, readability, and reusability) each as a letter grade.
Beneath them, an analysis-info grid presents the numbers behind the grades as tiles, each carrying a pass/fail adornment and a tooltip:
- Total logical and physical LOC
- #files, #classes, and #functions
- duplicate code %
- maintainability index
- cyclomatic complexity
- total violations
- code effort and comments density
The overview closes with an evolution section: the Evolution of Quality Characteristics and Evolution of Violations charts, so you can see whether things are trending up or down.
Metrics
Detailed metric scores, filterable by category: Maintainability, Security, Readability, and Reusability. Use this tab when you want the exact figure behind a characteristic grade.
Violations
The full violations list for the analysis. Browse the catalog of what Cyclopt checks for in the JavaScript violations reference.
Files
A per-file drill-down with a built-in code viewer, so you can jump straight from a metric or violation to the exact lines responsible.
Duplicates
Every duplicate-code instance detected in the repository, grouped so you can see what is repeated and where.
Compare
Compare quality between two commits, including a radar diff that highlights which characteristics improved or regressed between them.
Commits
The per-commit quality history for the repository, so you can trace how each change moved the numbers.
Evolution
Longer-range quality and LOC trends across the repository's lifetime.
Files and folders you do not want analysed can be excluded via the configuration file, and individual findings can be suppressed in-code with inline cyclopt-ignore comments.
Next step
Now that you can read the numbers, put standards behind them with Quality Gates.