Projects & overview
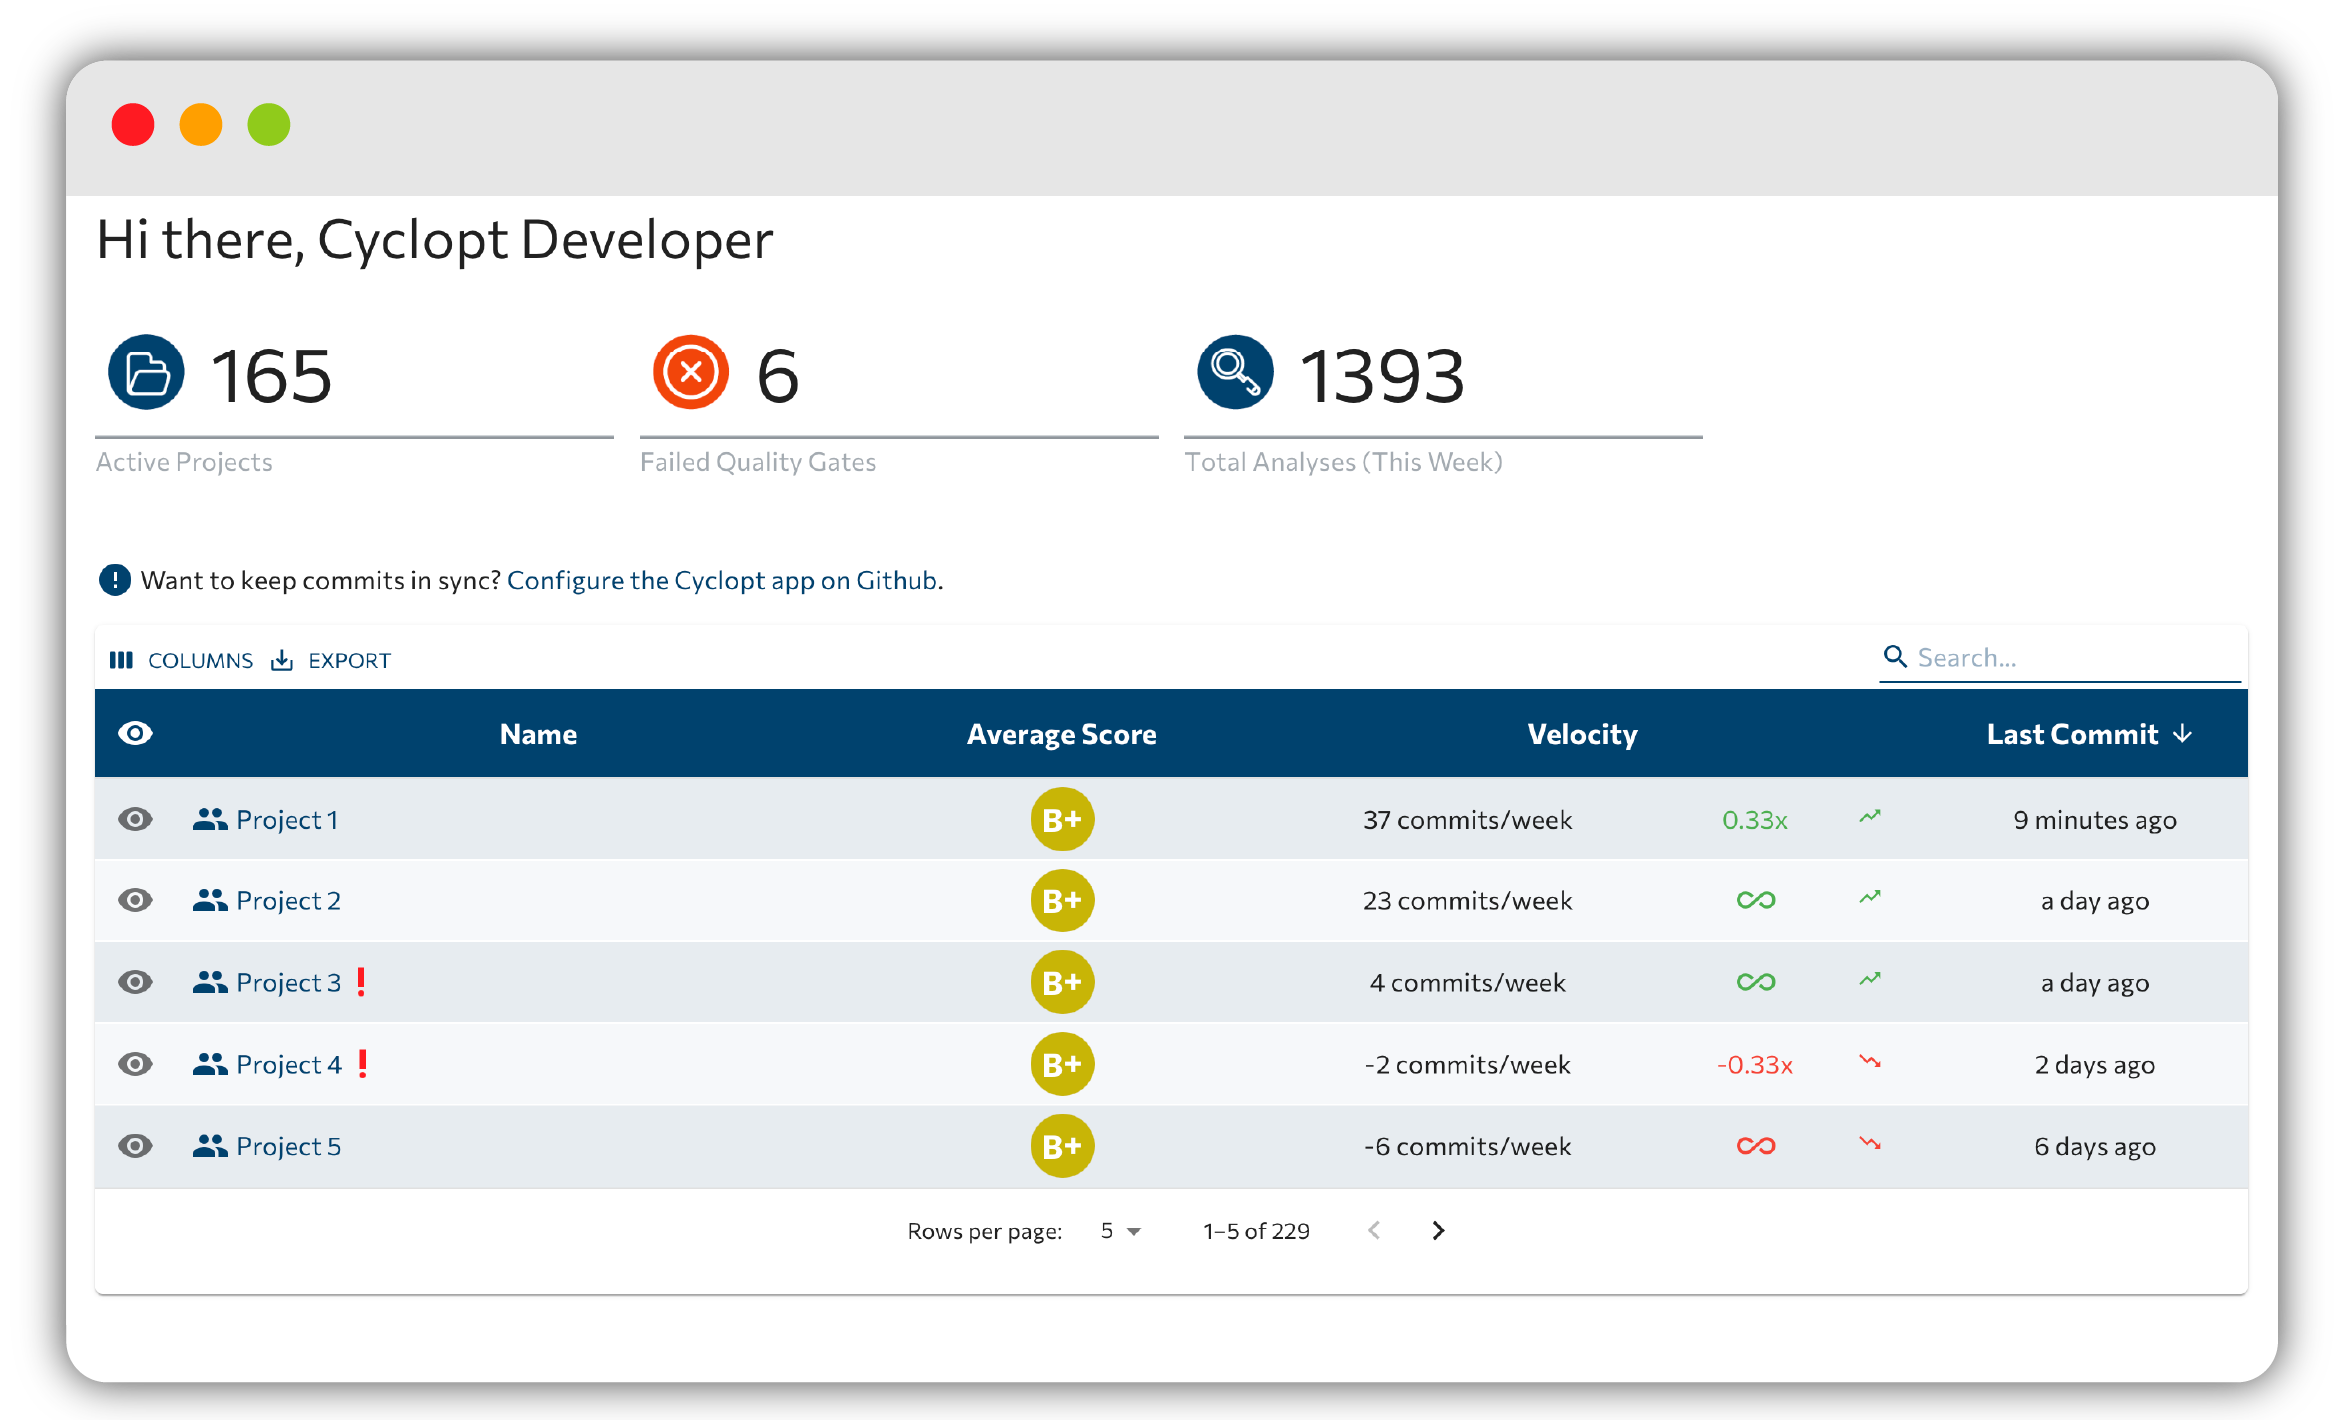
The Projects list is your home base for everything you're tracking. It greets you and surfaces the health of your work at a glance.
The Projects list
At the top, tiles show Active Projects, Failed Quality Gate(s), and Total Analyses (this week). A hint suggests configuring the Cyclopt app on GitHub or GitLab so your commits stay in sync.
The table below has these columns:
- A Shown visibility eye toggle to hide a project from your dashboards.
- Name, with a quality and quality-gate cell.
- Average Score, shown as a letter grade.
- Velocity: commits per week, with up, down, and flat trend arrows and tooltips such as "X times more commits this week compared to last week. Nice!".
- Last Commit.
Inside a project
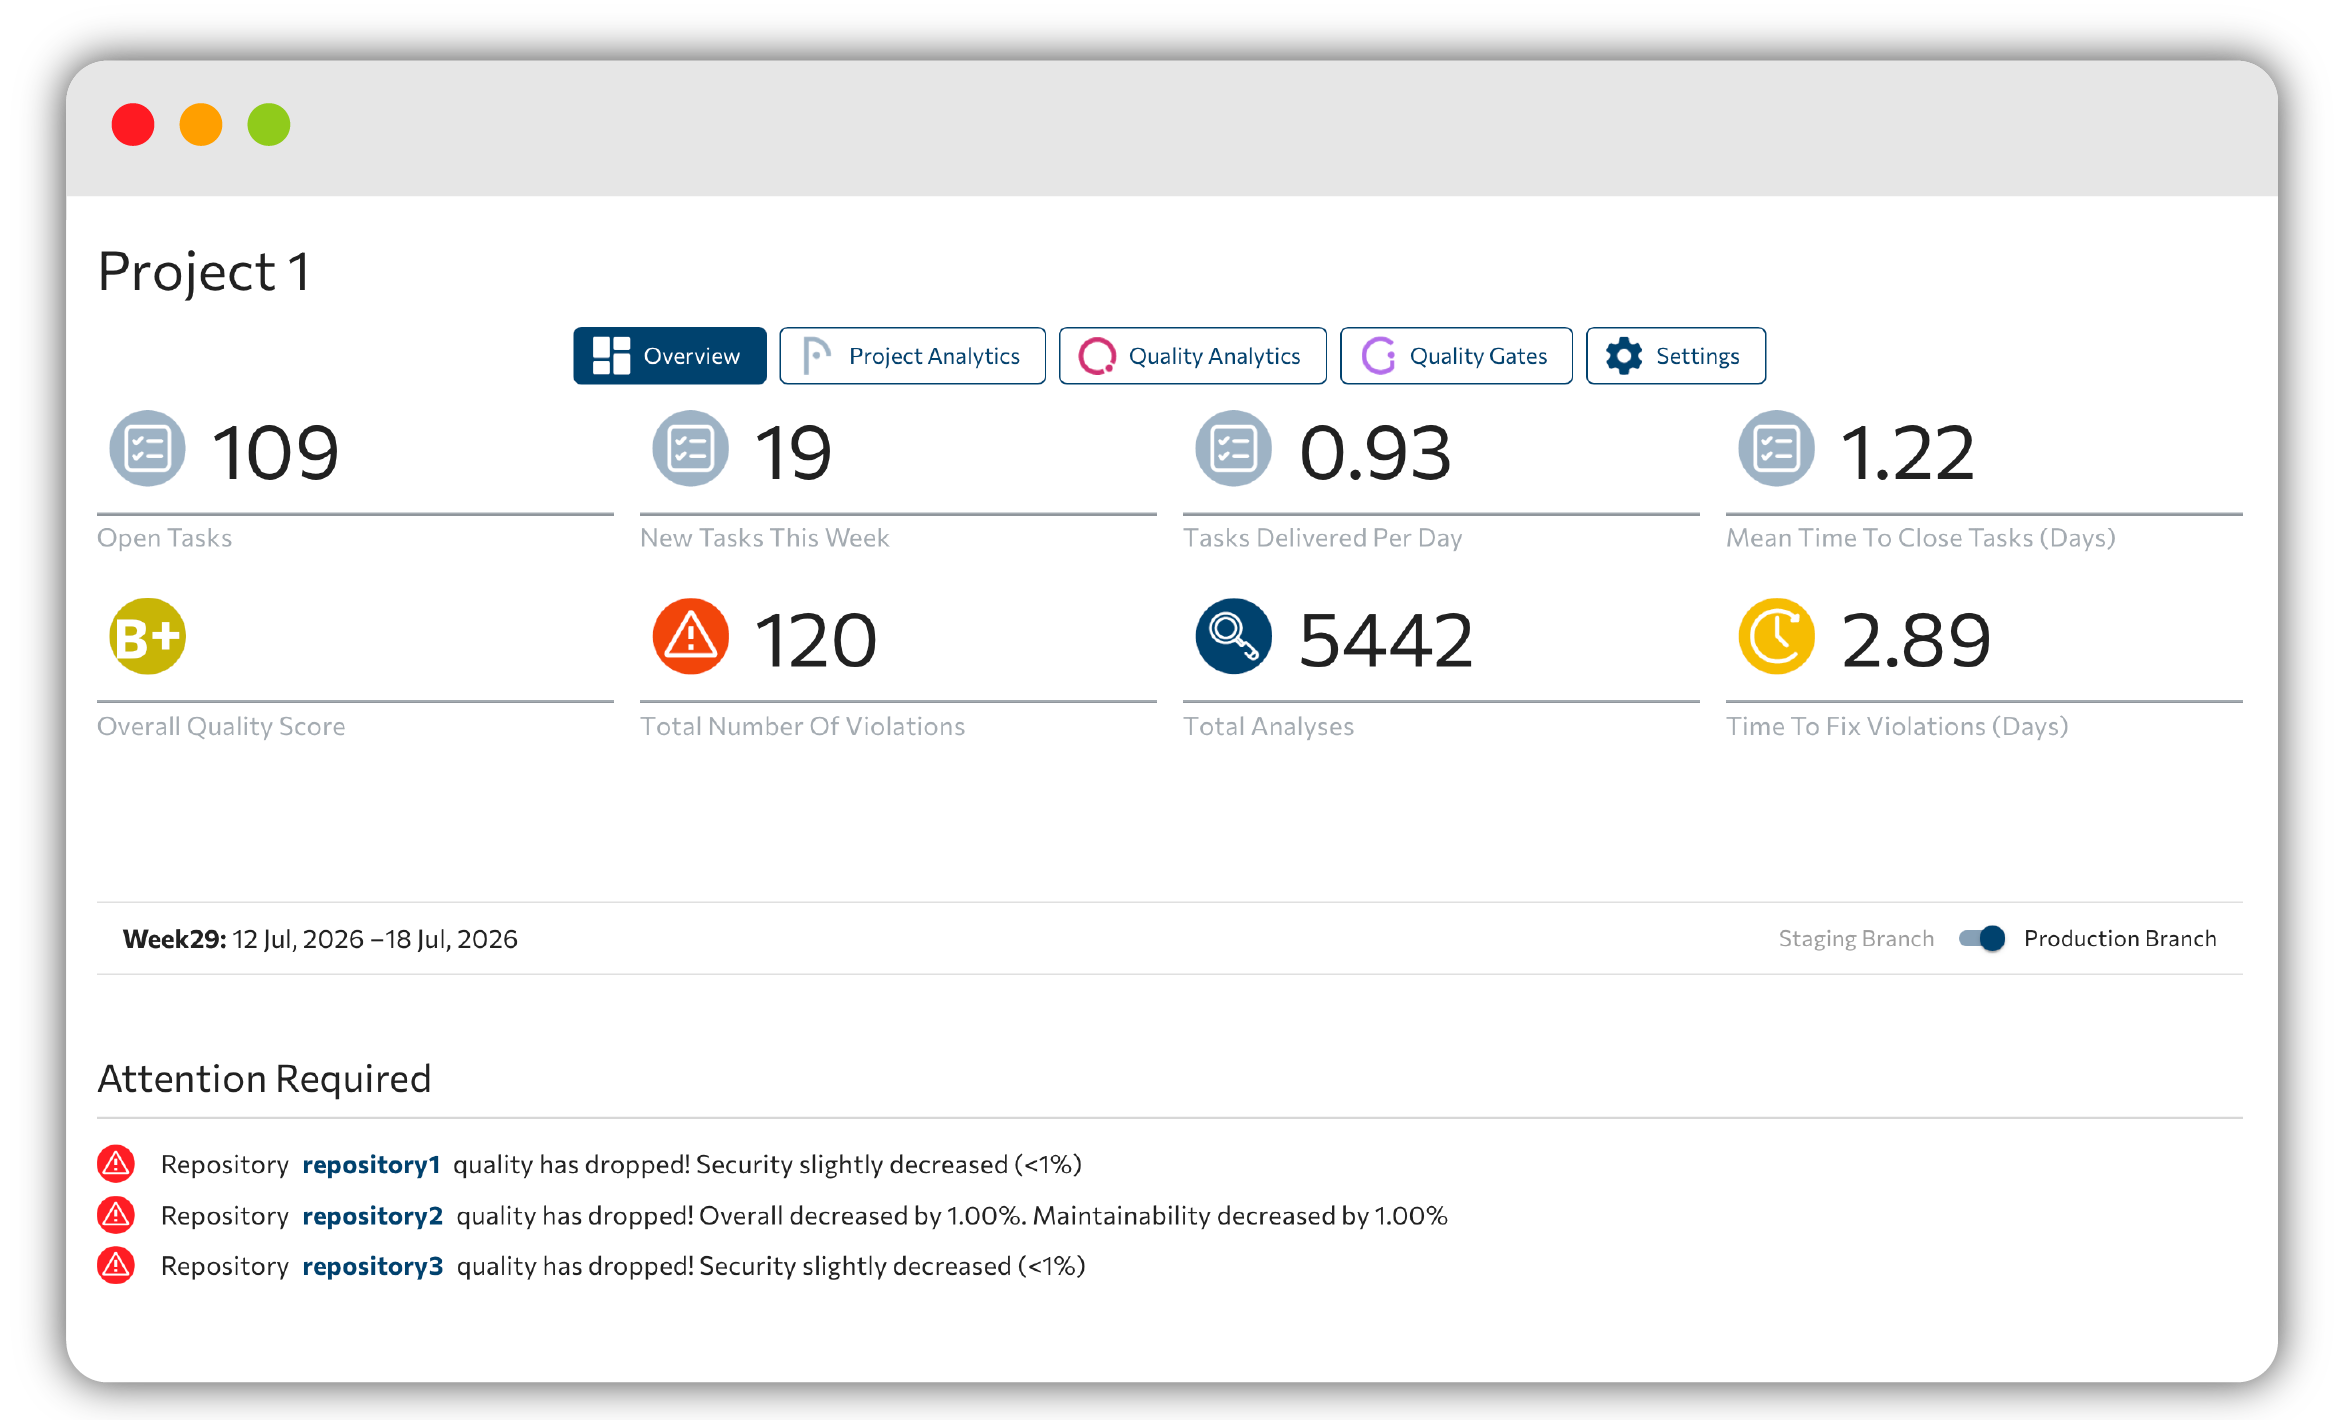
Opening a project shows its shell with tabs: Overview, Project Analytics, Quality Analytics, Quality Gates, and Settings.
note
Some tabs may be disabled depending on the project's configuration.
The Project Overview
The Project Overview brings everything together:
- Project Analytics tiles: open tasks, new tasks this week, tasks delivered per day, and mean time to close tasks.
- Quality tiles summarizing code health.
- A Repositories table showing each repository name with its provider icon, a production-branch chip, private/public and config-file icons, the language, a quality-score avatar, analyses, and last update.
- A collaborators avatar row and an Add Repository button.
- The weekly early-alert sections.
Where to go next
- Inspect code health in Quality Analytics.
- Set standards with Quality Gates.
- Track delivery in Project Analytics.
tip
Next step: continue to Quality Analytics.